Businesses generate vast amounts of data but struggle to extract actionable insights. Traditional reporting methods are static, slow, and prone to human error. The Orion Windo data visualization platform provides real-time analytics, trend identification, and predictive insights. Windo data visualization turns raw data from sensors, machines, and operations into a single, interactive dashboard. Enables real-time performance monitoring, anomaly detection, and predictive maintenance.
Customized IoT Data Visualization Services
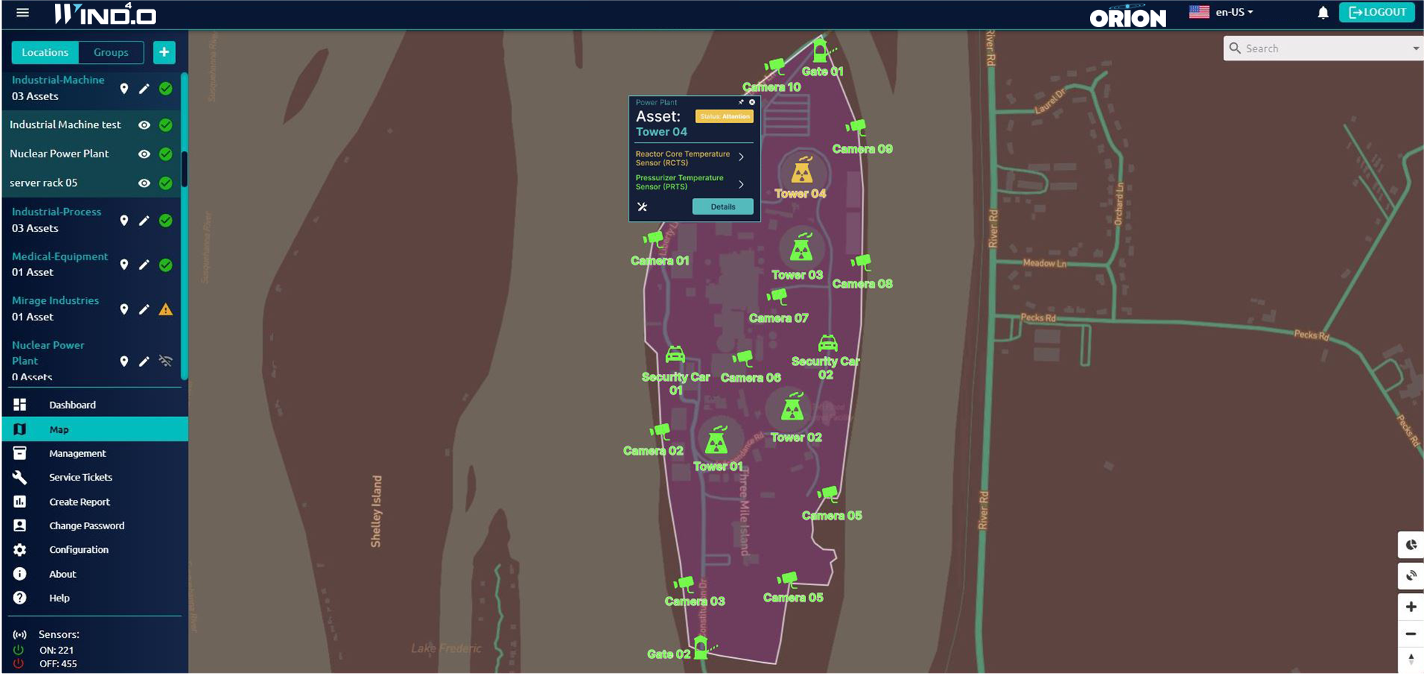
Orion provides an intuitive dashboard customized for actionable data visualization.
Visualization starts with a topographical view of the entire campus, with all cell sites and sensors highlighted. Color coding rapidly identifies areas for focus. Users can drill into any network sector, building, asset, or sensor.
enables data driven decisions
The Orion dashboard – “Windo” - highlights sensor location, status, and data streams. This is crucial for environments where reliability, security, and operational efficiency are paramount.
Real-time tracking of sensor status (online, offline, malfunctioning, etc.) allows quick identification of failures or anomalies in the system, ensuring immediate corrective action can be taken. This minimizes downtime and operational risk.